How does the bitcoin source code define its 21 million cap?
Many of bitcoin’s staunchest critics have expressed doubt about its 21 million cap, but perhaps the most mindless criticism relates…
,
First published: 04/17/2018
| Last
updated: 01/17/2023
| -- min read
Bitcoin uses a curious accounting structure called a UTXO — an Unspent Transaction Output. All UTXOs are timestamped by the transaction/block in which they were created. Since all bitcoin in existence is contained in some UTXO, this means that all bitcoins have an age: not the age/time when that bitcoin was first mined, but when it was last used in a transaction.
Since Bitcoin stores its full transaction history in the blockchain, it is possible to look backwards and analyze the age distribution of UTXOs over time. Unchained Capital first analyzed Bitcoin’s UTXO history a few years ago and what we learned encouraged us to start our crypto-lending product. We are now sharing our analyses publicly because we think they are fascinating and informative. Let us know if you agree.
On to the data science!
The following chart displays the age distribution of Bitcoin’s UTXO set historically back to the genesis block (Note: this chart does not display correctly on mobile devices.)
The colored bands show the relative fraction of Bitcoin in existence that was last transacted within the time window indicated in the legend. The bottom, warmer colors (reds, oranges) represent Bitcoin transacting very recently while the top, cooler colors (greens, blues) represent Bitcoin that hasn’t transacted in a long time. Bitcoin’s money supply grew from 50 BTC to ~17M BTC over this time period, so the chart has been normalized by the BTC in existence at each date (left y-axis). The black line shows the USD/BTC price (logarithmically, right y-axis). Chart provided and supported by Glassnode Studio based on prior work by @jratcliff [Direct Link]
This chart is fascinating because it displays the macroscopic shifts that have occurred in Bitcoin’s ownership through history. Spikes in the bottom, warmer-colored age bands (<1 day, 1 day — 1 week, 1 week — 1 month) indicate large amounts of bitcoin suddenly transacting. The steady growth of the top, coolor-colored age bands (2–3 years, 3–5 years, >5 years) shows bitcoin that’s not being transacted with, idling between rallies. The interaction between these two patterns illustrates the behavior of Bitcoin’s investors during market cycles.
It is not possible to make charts such as the one above for traditional asset classes. It’s only Bitcoin and other public blockchains that meticulously track these data throughout their whole histories. This enables post-hoc analyses of large-scale market behavior.
A common pattern after every rally in Bitcoin’s price is what we have named a “HODL wave.” A HODL wave is created when a large amount of Bitcoin transacts on the way up to and through a local price high, becoming recent BTC (1 day — 1 week old), and then slowly ages into each later band as its new owners HODL.
A HODL wave manifests visually on the chart as a pattern of nested curves caused by each age band becoming suddenly much fatter (taller) at progressively later times from the rally. The image below traces a few of the largest HODL waves.
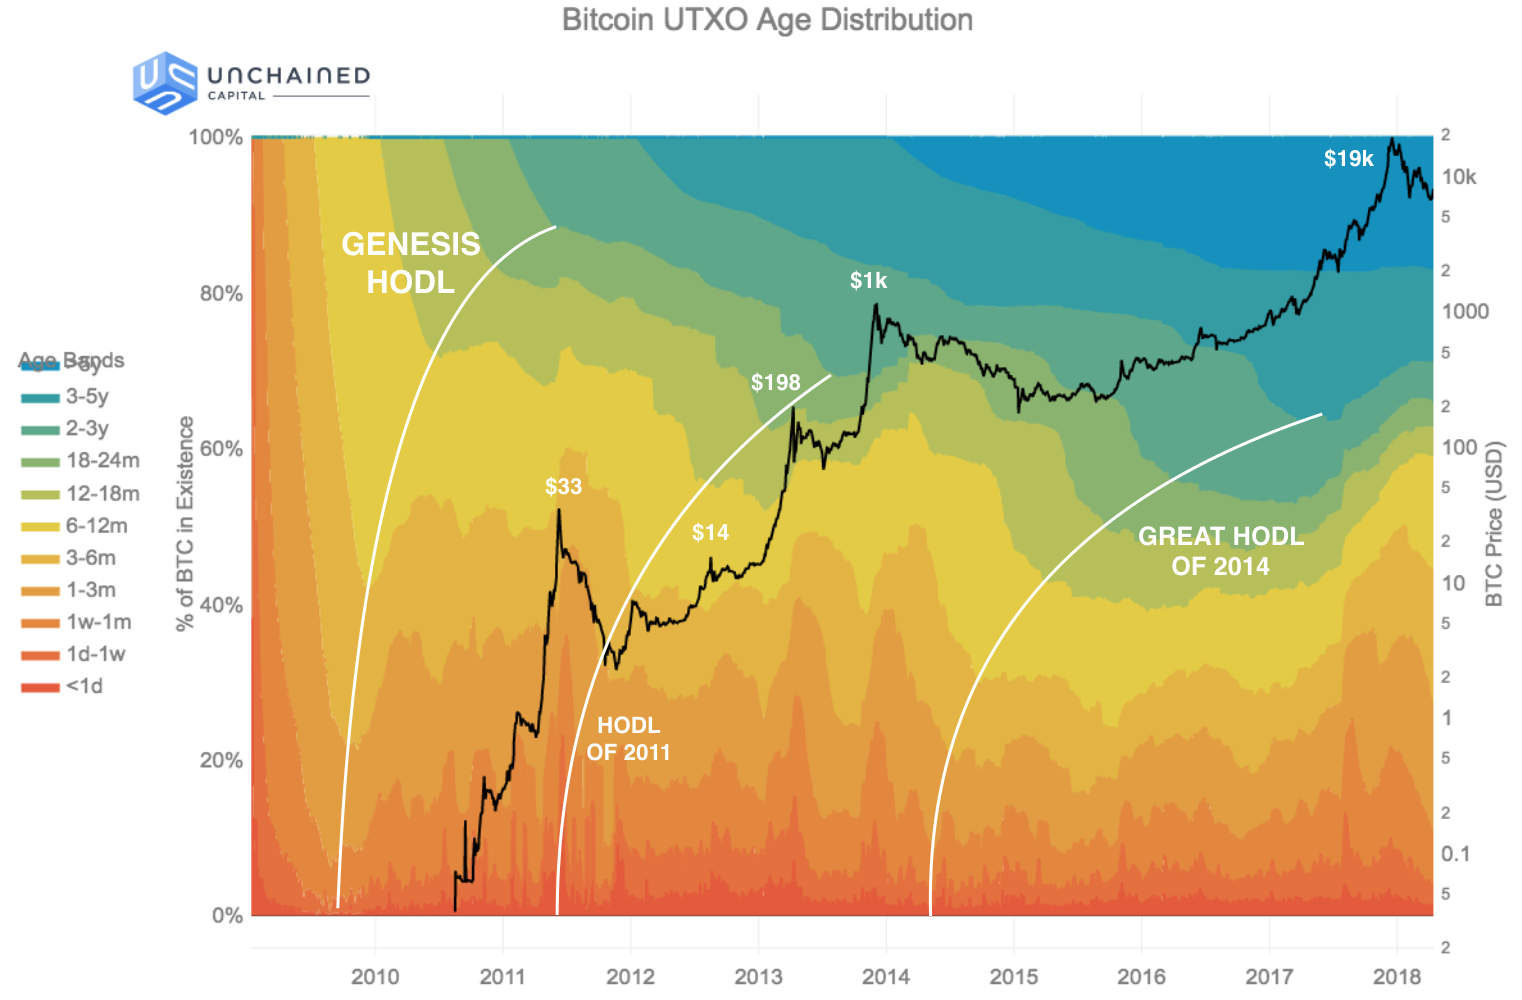

The first HODL wave — the “Genesis HODL” — was not caused by a price rally because Bitcoin had no price at that time. Instead, it was caused by the initial acquisition of Bitcoin by Satoshi and the other first miners.
During the first year of Bitcoin’s history the community was extremely small, transaction volume was low, and there were no exchanges to establish a USD/BTC price. The coins being mined during 2009 weren’t included in transactions very often for these reasons. They sat around and progressively accumulated into later age bands.
Consequently, each of the colored age bands appears suddenly in the diagram once sufficient time has passed since the genesis block (e.g. — the green 12–18 month age band appears exactly 12 months after the genesis block). The age band grows for a time, but then begins shrinking as all the existing Bitcoin ages into the next band.
Because there was nowhere to sell Bitcoin at the time, the Genesis HODL is one of the clearest HODL waves on the chart: early miners had no choice but to hold their Bitcoin and surf the wave. Later HODL waves are much frothier as holders could exit into fiat whenever they wanted.
The first time this pattern shifted was in mid-2010, going into 2011. The first Bitcoin exchanges, including Mt. Gox, launched in 2010. Bitstamp, Kraken, Coinbase all launched in 2011. The fraction of coins older than 12 months stopped growing in June 2010 for the first time. This is the first era where holders could trade Bitcoin online. Bitcoin’s price wouldn’t reach even $1 till February, 2011, but early miners likely had many thousands of BTC. Why not make a little cash?
By April 23rd, 2011, Satoshi had left Bitcoin, right as Bitcoin reached $1. Satoshi is estimated to hold ~1M BTC, so he/she/they/it was already a millionaire at this point. Maybe that was enough?
— Satoshi Nakamoto, April 23rd, 2011 (1 BTC = $1).
What a casual bastard. 🙂

Starting in June 2011, Bitcoin’s price suffered its first major collapse, from $33 all the way down to $2–3 by November 2011. It took almost two years to recover when it rallied to $198 in April, 2013.
During the rally up to $33 in June 2011, all the holders who sold were early miners by definition. No one else could really have acquired BTC to sell.
But the rally up to $198 was different. The age bands which shrunk the most leading up to the rally were between 12 months to 24 months. These were likely the first wave of investors — not miners — selling to realize gains. These investors would have acquired their BTC leading into the prior $33 price rally and afterwards.
Bitcoin collapsed again from $198 in April, 2013, down to $69 in July, 2013 only to soar past $1k by December, 2013. There wasn’t much time for panic-selling before a new surge of euphoria.
This was the first major rally that was covered in the news. Many major exchanges such as Bitstamp, Kraken, & Coinbase — not to mention Mt. Gox — had been around for a few years and were mature enough to service a large wave of demand for the first time.
Right after the rally to $1k, more than 60% of BTC had been spent within the last 12 months. This was the most “recent” moment for BTC’s money supply in history — the moment at which the average last time of use of a Bitcoin was lowest. Who sold? Once more, it was the investors who purchased in the prior 2–3 years, through the $33 peak and the $198 peak.
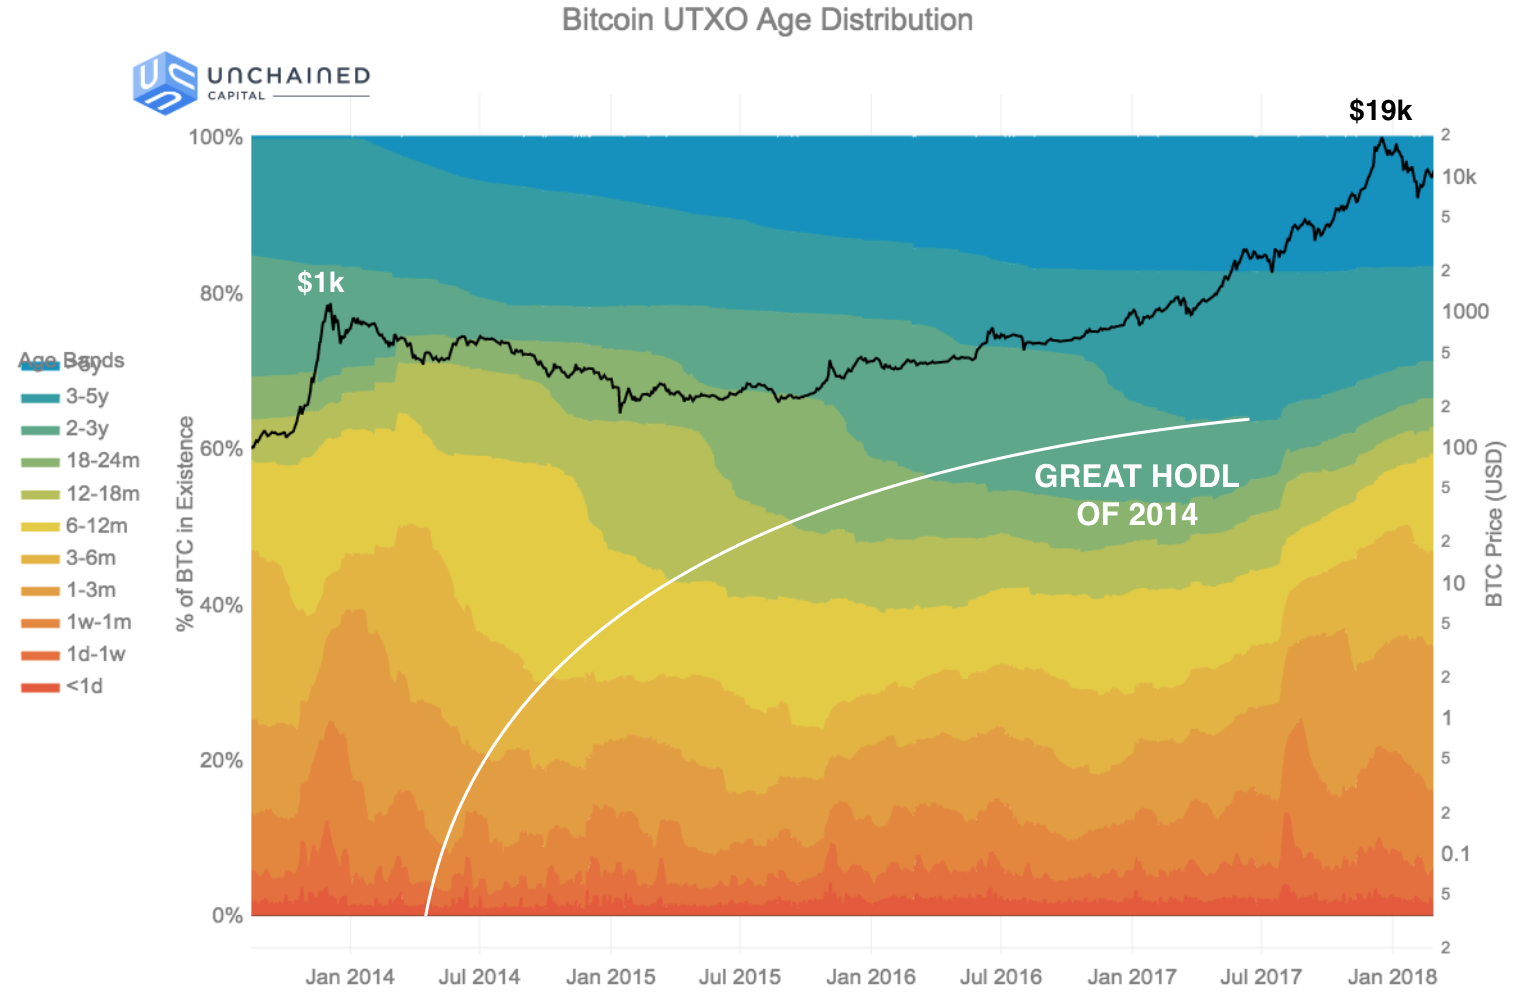
Ahh, the long winter of Bitcoin. After collapsing in December 2013, Bitcoin wouldn’t reach $1k again till February 2017, more than 3 years later.
But the rally to $19k, reached by the end of the year in December 2017, was truly spectacular. There was much more mainstream press coverage and many more new investors, including some extremely “traditional” investors such as institutions and funds.
As the price was crossing $1k in February, 2017, almost 60% of Bitcoin was older than 12 months. A year later, just after the peak at $19k, only 40% of Bitcoin was older than 12 months. During 2017, 20% of Bitcoin in existence was transacted with for the first time in years. Why? We see three separate, related reasons.
Capturing Gains
Some of the transaction volume in 2017 was about capturing gains. Investors who’d held BTC for 12 months or more were the sellers, with particular emphasis on those who’d held for 2–5 years. Fully 15% of BTC moved out of those age bands and became young again during this rally. The selling started almost as soon as BTC crossed $1k again, in February 2017.
ICOs
But this time period also corresponds with the rise in Ethereum, ERC20 tokens, and ICOs. Many ICOs accepted Bitcoin and many Bitcoin holders felt that investing their BTC into ICOs was a way to capture the meteoric rise in value of the ETH-ecosystem, as no similar growth was yet occurring in Bitcoin. So perhaps it was ICO fever that compelled Bitcoin holders into the warm embrace of ETH and ERC20 after enduring many years of frosty Bitcoin winter?
Bitcoin Cash & Segregated Witness
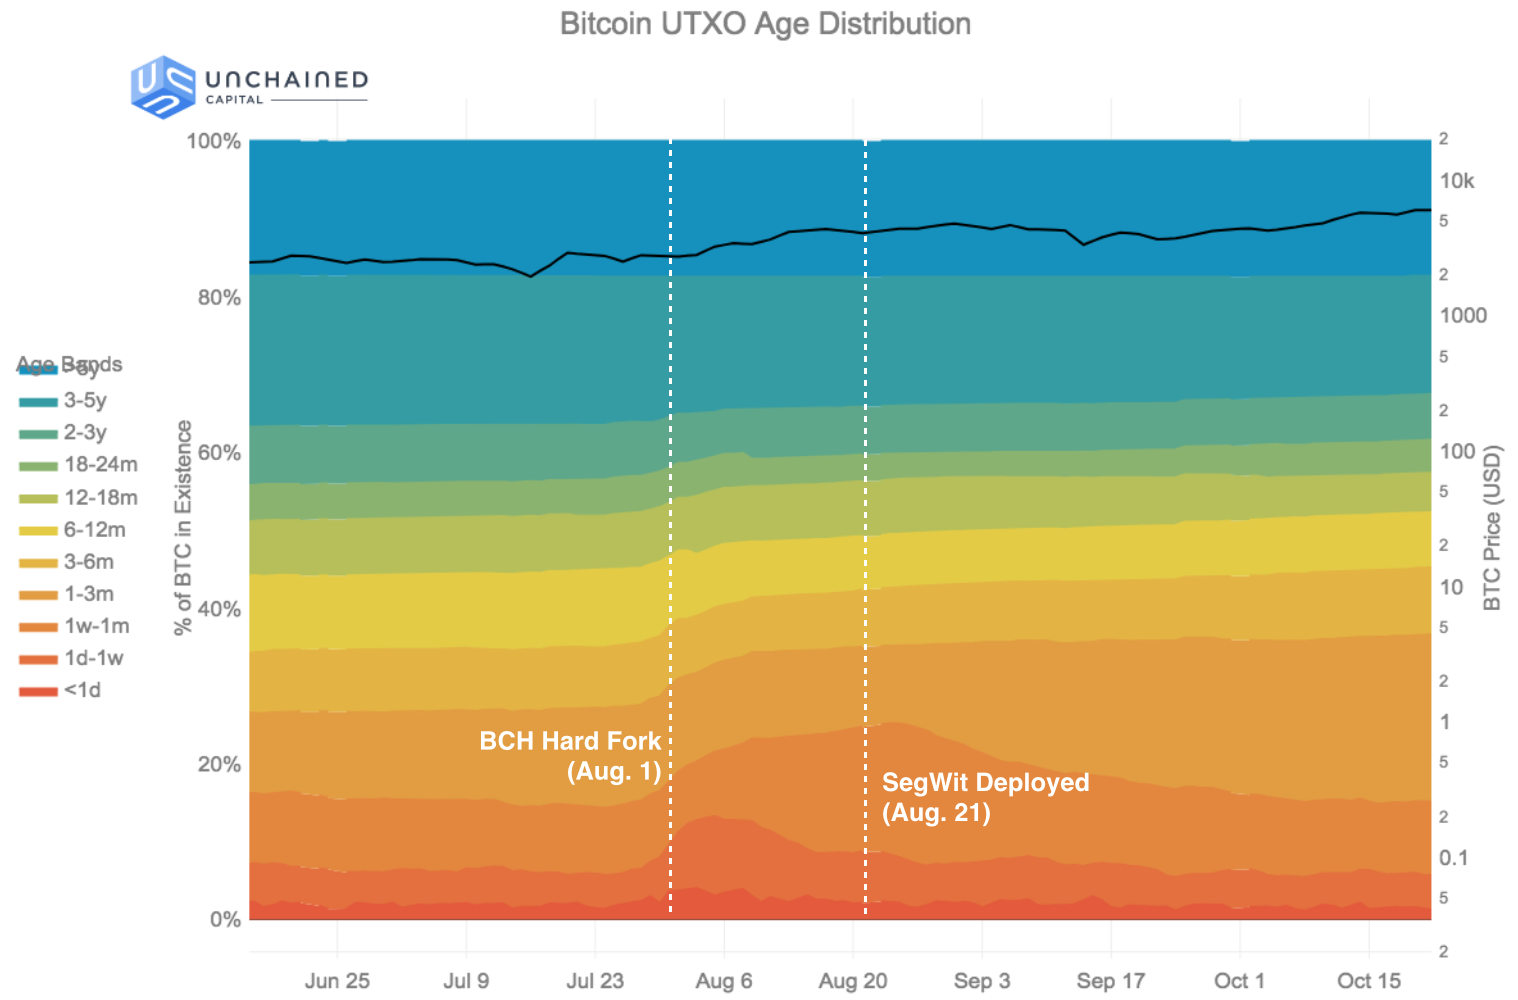
The final factor was the Bitcoin/Bitcoin Cash hard fork of August 1st, 2017, and the subsequent upgrade (on the Bitcoin side) to using segregated witness, on August 21st, 2017. Both these events caused large amounts of Bitcoin to transact for the first time in years as holders acted to claim coins on both sides of the fork and move their Bitcoin to new segwit addresses.
The data clearly shows the significance of this event. In the month of August 2017, 25% of bitcoin became less than one month old. That equates to nearly 4M BTC, or $17B of value at then prices.
Today, after the rise of 2017 and the fall in 2018, the fraction of Bitcoin older than 12 months has dropped to just 40%, making the average age of Bitcoin almost as “recent” today as it was just after the last big rally to $1k.
And after every great rally, there’s been a great HODL. As the data shows us, there is already the development of another generation of holders settling in for the long haul. Beginning in January 2018, the category of bitcoin that are 6–12 months old rebounded from a low of 7.76% to 14.63%, a doubling of its population.
It will be interesting to follow this new HODL wave over the next few months and years. What price will be required for the wave to break and a new cycle of gains-taking to occur? How much older will the average bitcoin get before the cycle begins again? How much larger will the next cohort of hodlers be?
If you’re curious about the answers, check back on this blog post over time. We will be continuously updating the UTXO age distribution chart above (also available as a direct link).
Many thanks to Taylor Pearson, Kyle Samani, Tushar Jain, هیهات منا الذلة, & Orie Steele for their invaluable feedback when reviewing this post.
This post is the first in a series using data science to tell stories about Bitcoin. It describes the behavior of Bitcoin HODLers during market cycles.
Stay tuned for
Unchained Capital has been doing data science on blockchains for years. Discovering the large amount of Bitcoin UTXOs older than 12 months convinced us to start a lending business to help cryptocurrency owners get value from their digital assets today while continuing to hold them into the future. If you are holding BTC and you’d like to borrow against your holdings, please sign up for an account on our website and apply for a loan.
Remember: Friends don’t let friends sell Bitcoin.
Many of bitcoin’s staunchest critics have expressed doubt about its 21 million cap, but perhaps the most mindless criticism relates…
,When Satoshi Nakamoto created bitcoin, he established in its code a fixed number of bitcoin that will ever exist. Since…
Originally published in Parker’s dedicated Gradually, Then Suddenly publication. Bitcoin is often described as a hedge, or more specifically, a…